


We’re all familiar with the concept of debt—you take out a loan, and over time you have to pay it back. According to debt.org, U.S. consumers owe a total of $14.9 trillion in debt as of May 2021. Debt can take many forms—college tuitions, car purchases, mortgages—but in the end, we know that money is owed, and we have to make good on that agreement or risk serious consequences to our future and financial standing.
So why does it seem like the government doesn’t feel the same way?
Right now, the national debt—which is made up of Treasury securities held by either individuals, companies, agencies, or governments both foreign and domestic—is sitting at more than $28 trillion. That’s $28 trillion in IOUs the government has sold in exchange for cash.
America has been in debt since 1789 with only one exception, so national debt is nothing new. But over the last couple decades—since 2001, to be exact—our national debt has virtually exploded to all-time highs. These highs are so astronomical that the Treasury Department is currently taking “extraordinary measures” to keep the government running while Congress tries to work out a solution to the federal government hitting its debt ceiling.
Incidentally, 2001 is also the year when U.S. Money Reserve was founded. So as we continue to celebrate 20 years of providing incredible service, let’s step back and examine what exactly happened with our national debt over that same period of time.
At the start of the 2000s, federal debt was increasing relatively slowly.
According to the government website TreasuryDirect, total public debt at the start of 2001 totaled $5.72 trillion. By the end of the year, that number totaled $5.94 trillion—an annual increase of just under 4%.
In fact, according to thebalance.com, the U.S. was actually on a downward slope in terms of national debt in 2001. After hitting a high of around 65% of our nation’s Gross Domestic Product (GDP) (which is how federal debt is often measured) in 1996, national debt had dropped to about 55% of GDP by the start of the new millennium.
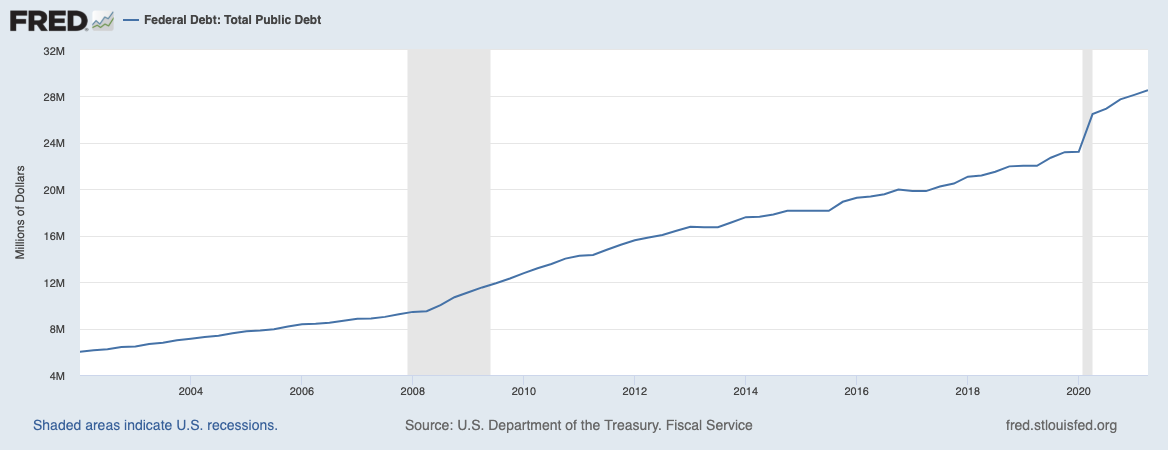
Curious to see where we’d be today if we stuck with 2001’s national debt increase of just 4% per year, I plugged the numbers into investor.gov’s compound interest calculator. Here’s what I found: If the national debt had increased at around 4% per year over the last 20 years, that debt would total about $13.02 trillion today. Instead, we owe more than twice that amount—more than $28.42 trillion.
So what happened?
Federal debt increased in response to multiple crises, both humanitarian and economic.
The reason I single out 2001 is not just because it was 20 years ago—it’s also because that year marked a major turning point in the history of federal debt. Tax cuts, which reduced government income, occurred in the same year as the devastating attacks of September 11, 2001. With the war on terror launched the following year, we entered a new age of government spending and consequently, government debt. In 2004, the Iraq War began, followed by the Hurricane Katrina disaster the next year. Then came the banking crisis, massive bailouts, and the start of the Great Recession.
In 10 short years, we went from our federal debt being 55% of GDP in 2001 to a whopping 95% of GDP in 2011. The debt crisis was in full swing, and in 2011 we experienced another debt ceiling issue coupled with additional tax cuts.
If our national debt had increased at the same rate as in 2001, it’s estimated that debt would be at about $13 trillion today, 20 years later. Instead, it took only half that amount of time, with our national debt hitting nearly $14.8 trillion by the end of 2011. Incidentally, gold during this time skyrocketed to record highs.
In 2012, with just over $16 trillion in federal debt, it had reached a full 99% of our nation’s GDP. The following year, the government was forced to temporarily shut down as Congress argued over a spending bill, and national debt finally went over 100% for the first time since 1946. Then, somehow, we just let that figure keep on rising.
In the second quarter of 2020, federal debt hit its highest level in U.S. history.
Prior to the new millennium, the highest debt-to-GDP ratio was experienced just after World War II, when public debt sat at 112% of GDP. Though we neared this amount in the first quarter of 2020, at 108.11% according to the Federal Reserve Bank of St. Louis’ online database, it was in Q2 that federal debt saw a massive spike as our nation experienced unprecedented shutdowns and quarantines, resulting in severe impacts on the U.S. economy. In that quarter, the federal debt-to-GDP ratio topped out at nearly 136%, largely because of the passage of a massive economic relief package.
We’ve since begun to lower that ratio, with the previously mentioned database putting national debt at about 125.5% of GDP as of Q2 2021. But next year’s federal budget has yet to be taken into account, and as things stand, the government has already hit the national debt limit, with the U.S. Treasury taking “extraordinary measures” to allow the government to continue functioning and keep the United States from defaulting on its debt in the near term.
As Steve Forbes put it in an August 26, 2021, article, “The ceiling on the national debt needs to be either raised or suspended; otherwise, the federal government will run out of cash and gimmicks in a few weeks.” Though it has never happened, America defaulting on its debt would have disastrous results, not the least of which would be a drop in our nation’s credit rating. As the BBC put it, “No one really knows exactly what would happen, but the likelihood is that markets around the world would plunge, and global interest rates would rise.”
This is where we answer the all-important question: “How does this affect you?” If the government were to default on its debt, living in America could become substantially more expensive, as the value of the dollar dropped and the cost of imported goods rose in response.
So while the government continues to try and find a solution to the latest debt crisis, there are actions you can take that may help protect your own wealth.
As the national debt has increased, so has the price of gold.
Take a look at this chart showing the growth of gold over the last 20 years
2020 also saw debt crises in the U.S.—a debt ceiling crisis in 2011 and soaring debt in 2020. This combination of events is no coincidence. Gold has historically been used as a hedge against market turbulence.
In the last 20 years, the government’s debt has swelled from under $6 trillion to more than $28 trillion. In that same amount of time, gold’s price has increased from around $270/oz. to $1,813.60/oz. on August 31, 2021—an increase of over 570%.
The truth is, no one can say for certain what the future holds. But if the events of the past 20 years provide any indication, three things seem certain to me: America will continue to struggle with national debt; individuals will continue to look to gold as a safe haven for their wealth; and U.S. Money Reserve will be there to help people protect their wealth through the power of precious metals.


